Report Types
iPOS Retail provides 7 built-in report types to help you analyse sales performance, stock movement, and tax records. Each report can be filtered by date, employee, and other criteria, and supports export and print functions.
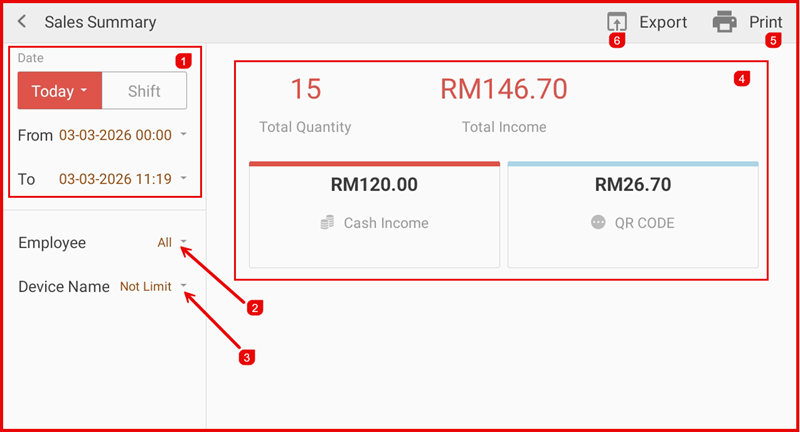
1. Sales Summary
The Sales Summary report gives an overview of total sales for a selected period. Use the Date filter (①) to select Today or a custom range, filter by Employee (②) and Device Name (③). The summary panel (④) shows Total Quantity, Total Income, and a breakdown by payment method (e.g. Cash, QR Code). Use Print (⑤) or Export (⑥) to save the report.
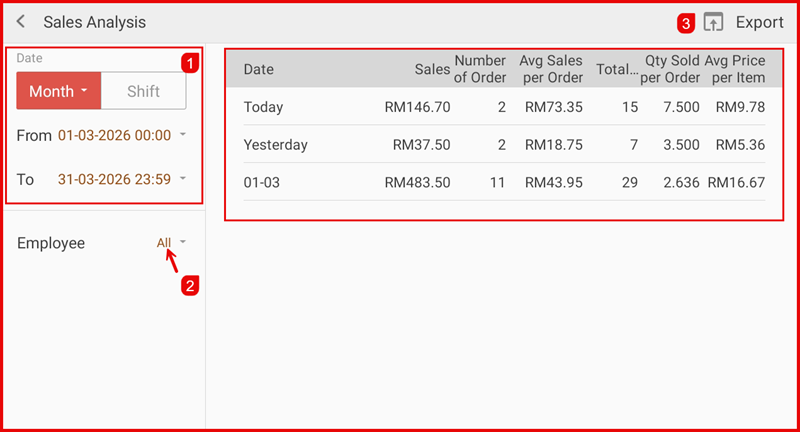
2. Sales Analysis
The Sales Analysis report breaks down sales performance over time. Set the Date range (①) using presets such as Today, Month, or Shift, and filter by Employee (②). The table displays Date, Sales, Number of Orders, Avg Sales per Order, Total Qty, Qty Sold per Order, and Avg Price per Item. Use Export (③) to download the data.
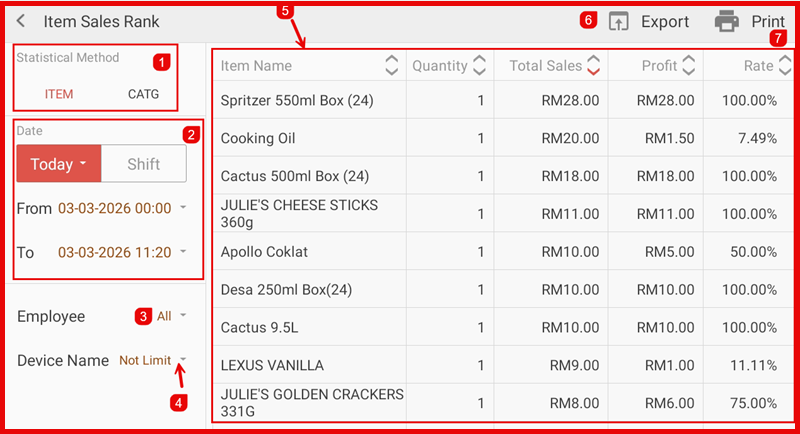
3. Item Sales Rank
The Item Sales Rank report ranks items or categories by sales performance. Choose the Statistical Method (①) — ITEM (by individual item) or CATG (by category). Set the Date range (②), filter by Employee (③) and Device Name (④). The ranked table (⑤) shows Item Name, Quantity, Total Sales, Profit, and Rate. Use Export (⑥) or Print (⑦).
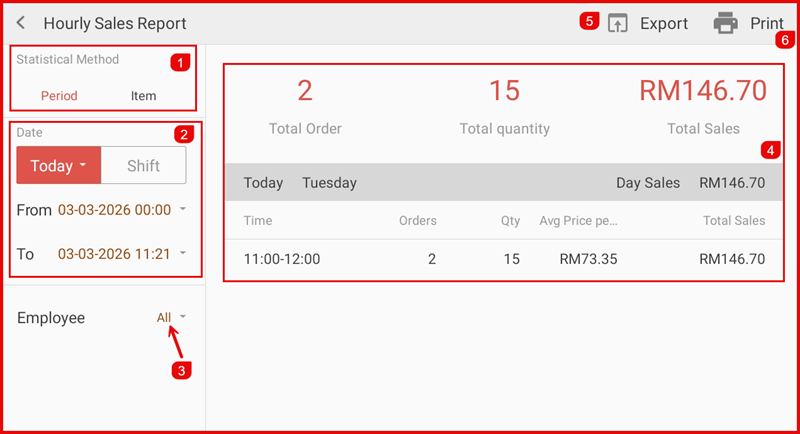
4. Hourly Sales Report
The Hourly Sales Report shows sales broken down by hour. Choose the Statistical Method (①) — Period (by time period) or Item (by item). Set the Date range (②) and filter by Employee (③). The summary (④) shows Total Order, Total Quantity, and Total Sales, with an hourly breakdown below. Use Export (⑤) or Print (⑥).
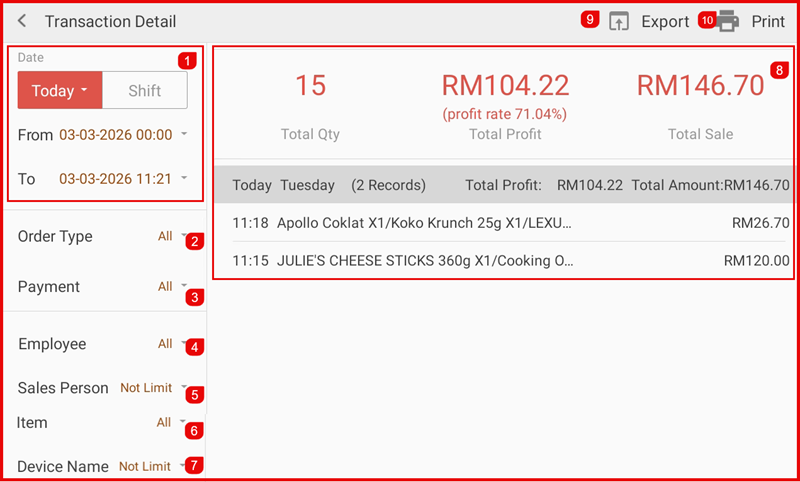
5. Transaction Detail
The Transaction Detail report shows full details for every transaction. Filter by Date (①), Order Type (②), Payment (③), Employee (④), Sales Person (⑤), Item (⑥), and Device Name (⑦). The summary panel (⑧) shows Total Qty, Total Profit (with profit rate), and Total Sale. Individual transactions are listed below. Use Export (⑨) or Print (⑩).
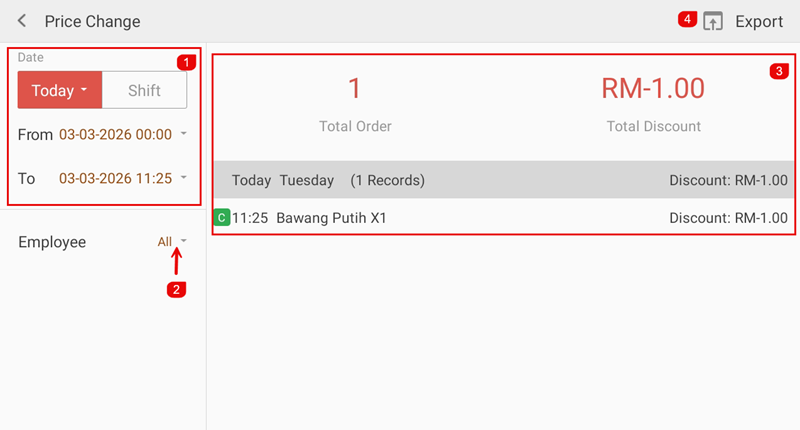
6. Price Change
The Price Change report tracks all price adjustments and discounts applied during a period. Set the Date range (①) and filter by Employee (②). The summary panel (③) shows Total Orders affected and the Total Discount amount. Each record shows the item, time, and discount applied. Use Export (④) to download the data.
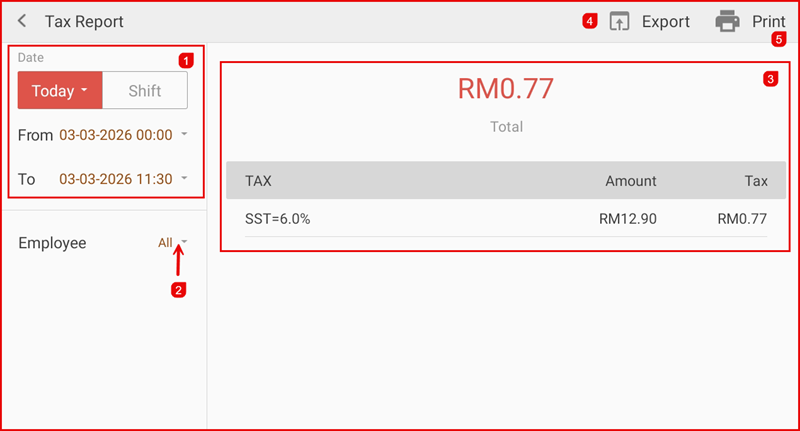
7. Tax Report
The Tax Report summarises the total tax collected for a selected period. Set the Date range (①) and filter by Employee (②). The panel (③) shows the Total tax amount collected, with a breakdown by tax type (e.g. SST=6.0%), the taxable Amount, and the Tax collected. Use Export (④) or Print (⑤).